All business owners know the value of tracking where your customers first found you. Whether it’s Yellow Pages (or Hibu as it’s about to become), direct mail or display advertising, you need to know the cost of gaining a customer and what is generating the best ROI (return on investment).
This is no different when it comes to your website and one of the best tools around is Google Analytics, which also happens to be free.
While Google Analytics is a fully specified tool for professionals to crunch data about website performance (I’m about to start studying for a Google qualification in the subject!), business owners who are pushed for time can quickly get valuable information about who is visiting their website, how long they are staying, what pages they are visiting etc.
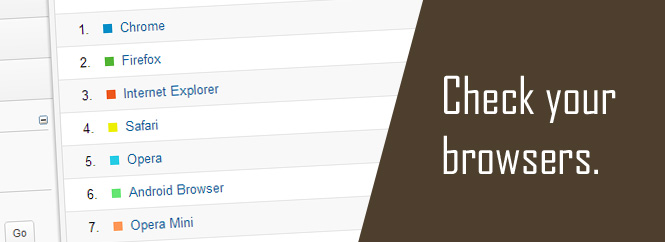
1) Check your browsers.
To access : Audience > Technology > Browser & OS
If you run a website, it’s imperative that you have Internet Explorer, Firefox, Chrome and Safari all installed. Whenever you make a change to your website, you need to check it loads correctly on all of these browsers. Even a website owner with perfect CSS will notice how certain aspects change in different browsers. By looking at your visitors and which browser they use, you can tweak your CSS to favour the main browser choice. You may also discover your site is popular with mobile users. If you find your mobile users increasing, would it be worth investing in a mobile version of your site?
2) Visitors Flow
Audience > Visitors Flow
This section can show you which page users land on, which pages they visit and more importantly, where they leave your site. Select the previous week using the date range at the top to view how users navigate your site, week by week. If you spot a page with a high drop off rate (the red arrows) then it may be an idea to take a look at that page. Is there a dead link? Can the user find where to go next? Also, look where they went. Did they flow onto the correct page or did they jump to an irrelevant page? If so, is you navigation clear? A quick 10 minutes at this can quickly reduce your drop off and bounce rate.
3) Referrals
Traffic Sources > Sources > Referrals
Referrals are the page that the visitor was looking at before they visited your site. This can provide a wealth of knowledge which is often overlooked. It may be that the user was on a forum and someone recommended you or someone has linked to you on their own website. Sometimes it could be the opposite and a user is unhappy with something on your site. This may be something as simple as them asking on a forum is they can load your site correctly or complaining your prices are too high. Take the time to look at these and alter your website/business accordingly.
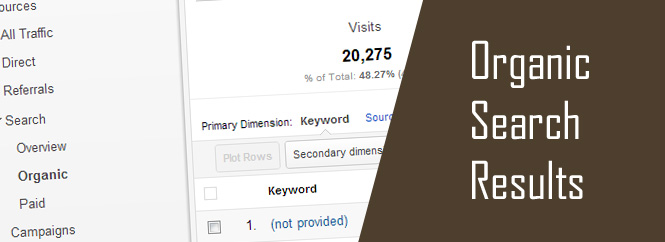
4) Organic Search Results
Traffic Sources > Sources > Search > Organic
This section allows you to see what keywords your visitors typed in to find your website. Take the time to view ALL of your keywords as this is what your users were looking for and either wanted to buy or find information on. Do you have what they wanted? If not, can you add it?
Lets say you run a site making tea pots and you have quite a few users coming for terms like ‘paint your own teapot’ or ‘make your own custom teapot’. Would it be worth introducing a blank range of teapots with painting equipment? Suddenly you’re selling a unique gift and people are starting to link to your site with terms like “check out this birthday gift idea” or “unique mothers day gift”. You’re now rising up the search rankings for ‘gift terms’ and enjoying more sales all because you took 5 minutes to look at your search terms.
If used correctly, you can even let this provide you with content for your site! Say someone searched for a question and found your site, do you know the answer? If so, add an FAQ section to the site and answer it.
5) Site Search
Content > Site Search > Search Terms
This is a must for an e-commerce site and can be quite beneficial for general sites. Most sites can be broken down into 2 categories
- E-commerce (selling a product online).
- Information (generally site designed to explain what services your company offers).
No matter which category your site falls into, you will want to know what your visitors require. Knowing the search term they came to your site for is nice but what if they could actually tell you what they want? If you have a search box on your website you can tap into this. Once set up, Google will show you exactly what searches have been made on your site. For an e-commerce website this information is like gold. Did the visitor search for a product you don’t sell? How many have searched for it? See if anyone else is selling this product and if not, can you? If you have an information website such as a car dealership and a user has searched for “Mazda” then would it be worth creating a page about Mazda cars and perhaps even including reviews of the most popular models?
6) Site Content
Content > Site content > All pages
This section allows you to see all of the pages on your site and how many visitors have been to them. As with most sections you can select the date range from the top right. If you have seen a sudden spike in traffic, this is great way to find out which page they are going to.
This section can also be used to find out which of your pages aren’t performing as well. A page which gets little visitors can be a sign of a page which isn’t properly optimised for Google or doesn’t have enough content. Check the bounce rate for the page which should be next to the page URL and if it’s high, try and assess why. The same can also be done with any page on your site – not just the least popular.
7) Goals
Conversions > Goals
This entire section is mainly aimed at e-commerce sites but can also be used by any site productively. The most popular use for goals is to track every time someone purchases something from your site. Once you have set up goals you can also view them in your referrals and your organic search keywords. This can often be great for finding out which keywords convert best. Capitalise on these by tweaking the wording in your site to match.
If you don’t have an e-commerce site, why not set up goals for your contact page? Again this will allow you to work out where your enquiries come from and what they were looking for.
For e-commerce sites, I would also consider setting up Goal flow as this allows you to view each step of your checkout and in turn work out where people abandon their cart. Maybe your site asks for too much information when signing up? Could a guest checkout be introduced? How about having the address automatically filled in or maybe even removing some of the checkout pages all together.
8) Real time
Real time > Overview
Finally if you have any time spare you can actually watch users navigating your site in real time via the real time section. Sometimes watching users browse your site allows you to work out where your site excels or fails. If a user jumps form page to page quickly, it’s an indication that they cant find what they want. If a user takes their time on each page, do they have too much to read? Is the page clear and easy to read?
9) Headline data
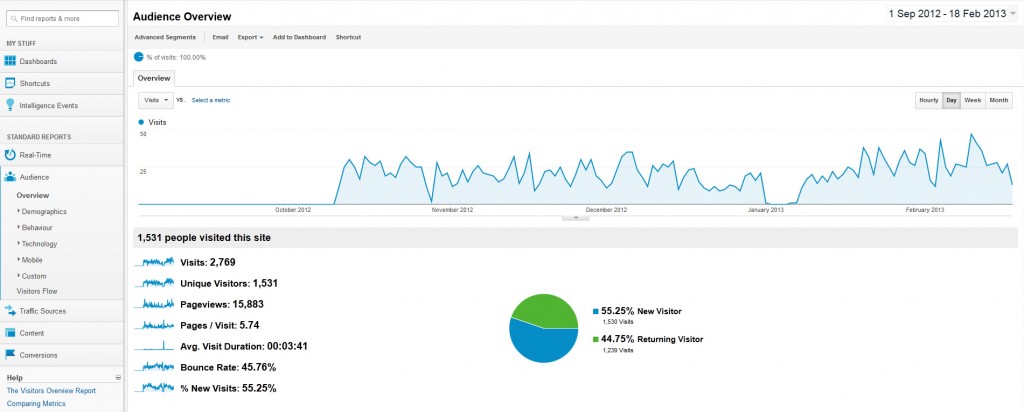
Audience > Overview
This is the summary data that gives an overview of the website performance.
If you are going to check one piece of data, then look at Bounce Rate which is a measure of how many visitors leave your website immediately. The higher the bounce rate the worse your home page is performing in terms of engaging interest and getting people to buy or contact you about your services. As a rule of thumb any bounce rate greater than 80% indicates serious problems with your website which need to be addressed urgently.
Of course the ultimate indicator is how many people are people are getting in touch after visiting your website whether it’s phoning, filling in an enquiry form or buying a product directly. Understanding a little more about your web visitors, their behaviour and how they find you is a positive step towards generating more business.
Please get in touch with Dinesh if you have any further questions about Google Analytics on 01788 844014 or fill out our Contact Form.
This post was based on a very good blog article from Squirrel Hosting, visit the original here: Google Analytics tips in 20 minutes


