In our previous blog post – Web traffic sources and how to measure what is working using Google analytics – part 1 – we looked at the main sources of web traffic. These include direct traffic from people using your web address, links from search engine results pages, social media and other websites, email marketing links and PPC advertising.
Once you have generated all this web traffic you need to make sense of what it means for your business and detect any patterns that will help you improve future performance and spend your budgets more wisely. We will cover the main features of Google Analytics shortly but remember, the most important Key Performance Indicators (KPIs) from any marketing activity are direct sales or enquiries by phone or email as a direct result of your website contents. By increasing the web traffic you make this more likely to generate business but some understanding of Google Analytics data will help you make better decisions on what is working on your website.
Using Google Analytics
Google Analytics is a free service that can be installed on your website and use to monitor web traffic. Once you setup an account and add your website, Google will provide a piece of code that needs to placed on all the pages that you want to track.
![]()
If you have a content management system such as WordPress or Joomla then there are plugins that can manage this for you, or you can simply insert the code in the header file for your theme. If you have a static HTML website, then you need to ask your web developer to insert the tracking code on all the pages.
Once you have Google Analytics successfully installed then you can start using the huge amount of data as a tool for reviewing performance. It is is a big subject but here are some of the most important pieces of information and what they mean for your business.
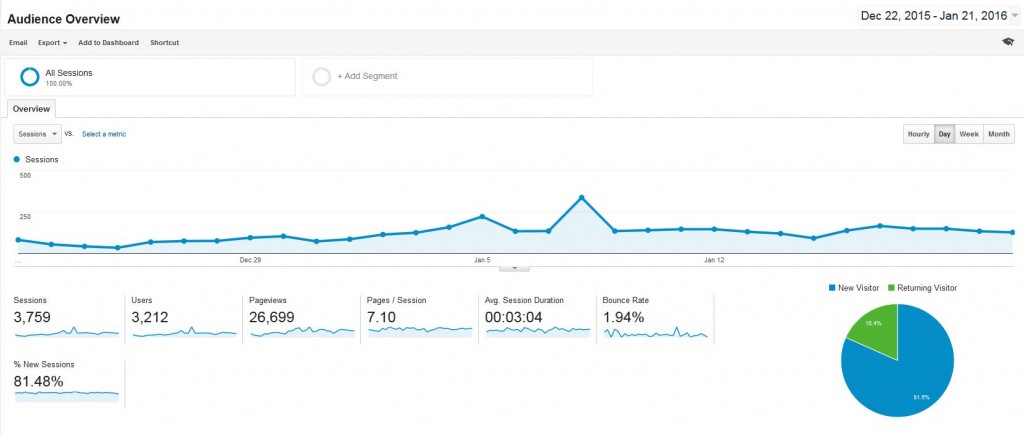
The first place to go is your overview in Reporting > Overview.

Sessions – A session is the period time a user is actively engaged with your website, app, etc. All usage data (Screen Views, Events, Ecommerce, etc.) is associated with a session.
Users – Users that have had at least one session within the selected date range. Includes both new and returning users.
Pageviews – Pageviews is the total number of pages viewed. Repeated views of a single page are counted.
Pages / Session – Pages/Session (Average Page Depth) is the average number of pages viewed during a session. Repeated views of a single page are counted.
Avg. Session Duration – The average length of a Session.
Bounce Rate – Bounce Rate is the percentage of single-page visits (i.e. visits in which the person left your site from the entrance page without interacting with the page).
% New Sessions – An estimate of the percentage of first time visits.
Just at a glance this page will give you a good overview of how your website is performing. For me, ‘Bounce rate’ is a highly significant indicator with the lower the number the better. If a website page has a bounce rate of over 90% then it means that users are leaving too quickly without engaging further with any further part of the website. The ‘Pages / Session’ metric indicates how likely people are to move to other parts of your website which is a good indicator of the effectiveness of your website in keeping people engaged.
Drilling down further into the data you can reveal additional useful information using Google Analytics.
Technology used – percentage splits of users between mobile, desktop and tablet. Go to Audience > Mobile > Overview.
Locations of users – Countries and even towns of users. Go to Audience > Geo > Location.
Sources of traffic – The channel split between Organic search, Direct traffic, Referrals and Social. Go to Acquisition > All traffic > Channels.
Main landing pages – These are the pages where visitors first arrive. Go to Acquisition > Search Engine Optimization > Landing Pages.
Queries – These are the keywords used on Google to find your website. Go to Acquisition > Search Engine Optimization > Queries.
As well as historical data you can see realtime traffic so you can monitor particular initiatives live. Using Google Analytics you can also set goals to monitor, for example, the path through shopping cart pages and setup Custom reports to review web traffic versus say time of day.
This is scratching the surface of what you can do with Google Analytics. We will produce further information on our Advice pages for more tips on using Google Analytics. Get in touch with Dinesh on 07941 686113 or submit our contact us form.


