If you own or run a website then you need sound information to make good business decisions and data from Google Analytics can be a great help. There is a wealth of data available but in this blog post we’re focusing on how to use Google Analytics to check the busiest times on your website.
First of all let’s look at a quick tour through important parts of the Google Analytics. Make sure that Google is functioning properly on your website by simply checking the data is updating or specific actions through – Tag Assistant Recordings. This is a free Chrome browser extension that let’s you record the tags, events and interactions for any arbitrary series of pages or sites you visit. Google Tag Assistant Recordings can be used to record all the pages that make up a complete user flow, even if part of the flow doesn’t occur on your primary domain.
Once you are sure the data is a true reflection of your web traffic then you can start to gather useful information.
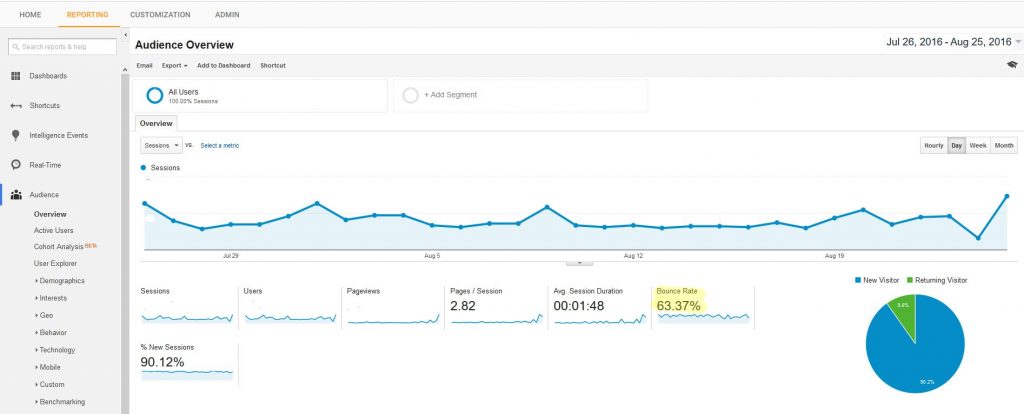
The best place to start is Audience > Overview.
Apart from the raw number of sessions the most important number here is Bounce rate.
Bounce rate is defined by Google as the percentage of single-page sessions (i.e. sessions in which the person left your site from the entrance page without interacting with the page).
Anything less than about 80% is pretty good, but the lower the better. High bounce rate websites are downgraded in search engine rankings as it is a relatively simple and proven number that Google uses to judge the user experience. If your bounce rate is high it means that people are jumping off your website without exploring further. This might not appear fair but it’s a number that Google trust and you need to work to improve it.
Once you have the overview of your web traffic health then you can explore further or customise the data to view specific items of interest such as website visits by Time of day or Day of the week.
This will help you get a picture of your website users and help answer many questions that will help you with marketing:
- The times you get the most visits – is it normal office hours or it the evenings or mornings? Are there regular spikes of traffic at particular times?
- The days of the week you get the most visits – are weekdays or weekends your busiest times? Is there a particular day of the week that is most popular?
This type of information can help improve the timing of your marketing initiatives: when is the best time for website maintenance and when to launch new products and services. So how can you use Google Analytics to check the busiest times and days on your website?
Use Google Analytics to check the busiest times and days
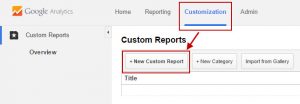
To check the sessions versus time of day you first need to go to Customization and click on ‘New Custom report’.
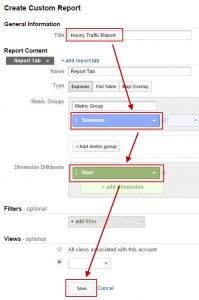
Call it something sensible such as Hourly traffic report. Then in Metric Groups, select ‘Sessions’ from the ‘Metric Groups’ and ‘Hour’ from the ‘Dimensions Drilldown’ and click ‘Save’.
You will then see a graph and a data table with the count of sessions throughout the day.
To check the busiest days of the week go to Customization and click on ‘New Custom report’. Call It something sensible such as ‘Days of the week report’. Then in Metric Groups, select ‘Sessions’ from the ‘Metric Groups’ and ‘Days of the week name’ from the ‘Dimensions Drilldown’ and click ‘Save’.
You will be able to see average number of visitors (sessions) for each day of the week within the data table:
You will be able to export this data as a spreadsheet, or click on comparison tool to get a comparison to average. At a glance this will show you the highest traffic days of the week.
Please get in touch if you have any questions about using Google Analytics to generate useful marketing information.
For more information visit this page: Google Analytics: Hour of Day & Day of Week Reports


